Examples
Here are some simple examples which will show you how to create dashboards with DevDash, step by step.
If you want real use case I use myself, it’s here.
You can find here a high level explanation of the config system, if you wonder what’s the heck is all of that.
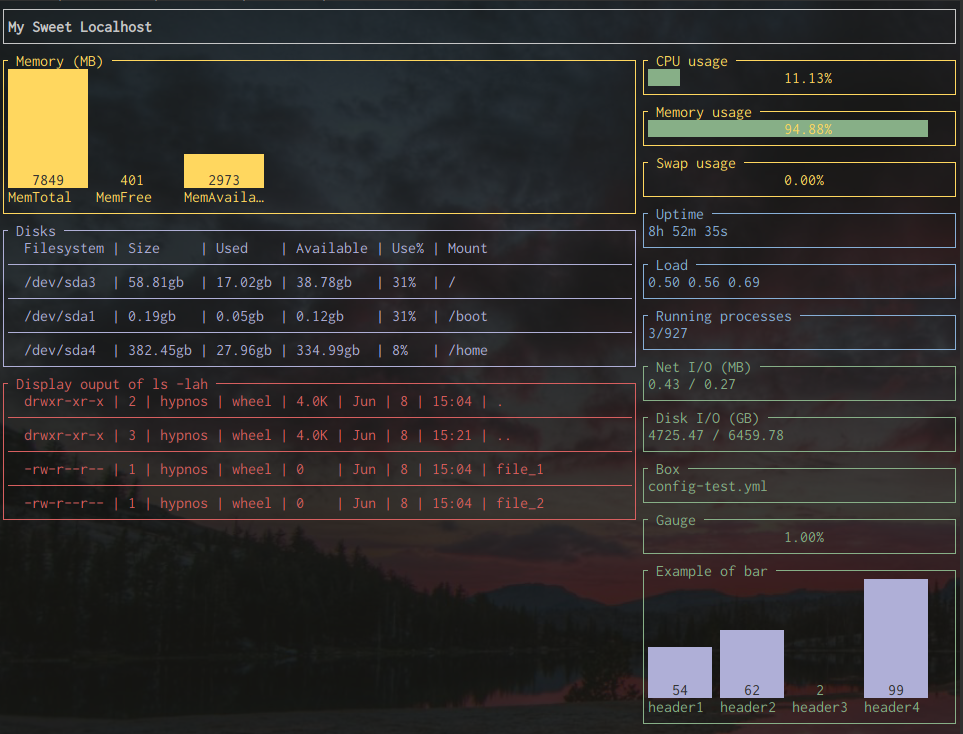
System Monitoring
If you run a Linux distribution, you can create a simple dashboard monitoring your system. It might work with macOS, too.
Notice that you can run any command line and display the output in DevDash! It’s how the output of ls is displayed here. Running a script works too!
---
projects:
  - name: My Sweet Localhost
    widgets:
      - row:
          - col:
              size: "8"
              elements:
                - name: lh.bar_memory
                  options:
                    unit: "mb"
                    color: yellow
                    bar_gap: 1
                    bar_width: 10
                - name: lh.table_disk
                  options:
                    color: magenta
                - name: lh.table
                  options:
                    title: " Display ouput of ls -lah "
                    command: "ls -lah test | tail -n +2"
                    color: red
          - col:
              size: "4"
              elements:
                - name: lh.gauge_cpu_rate
                  options:
                    color: yellow
                    bar_color: green
                - name: lh.gauge_memory_rate
                  options:
                    color: yellow
                    bar_color: green
                - name: lh.gauge_swap_rate
                  options:
                    color: yellow
                    bar_color: green
                - name: lh.box_uptime
                  options:
                    color: blue
                - name: lh.box_load
                  options:
                    color: blue
                - name: lh.box_processes
                  options:
                    color: blue
                - name: lh.box_net_io
                  options:
                    color: green
                    unit: "mb"
                - name: lh.box_disk_io
                  options:
                    color: green
                    unit: "gb"
                - name: lh.box
                  options:
                    color: green
                    command: "ls"
                - name: lh.gauge
                  options:
                    color: green
                    bar_color: magenta
                    command: "sh ./data.sh"
                - name: lh.bar
                  options:
                    color: green
                    headers: "header1,header2,header3,header4"
                    bar_color: magenta
                    command: "sh ./data-bar.sh"
You can go [here if you want to know more about the host service}(/reference/services/host/).
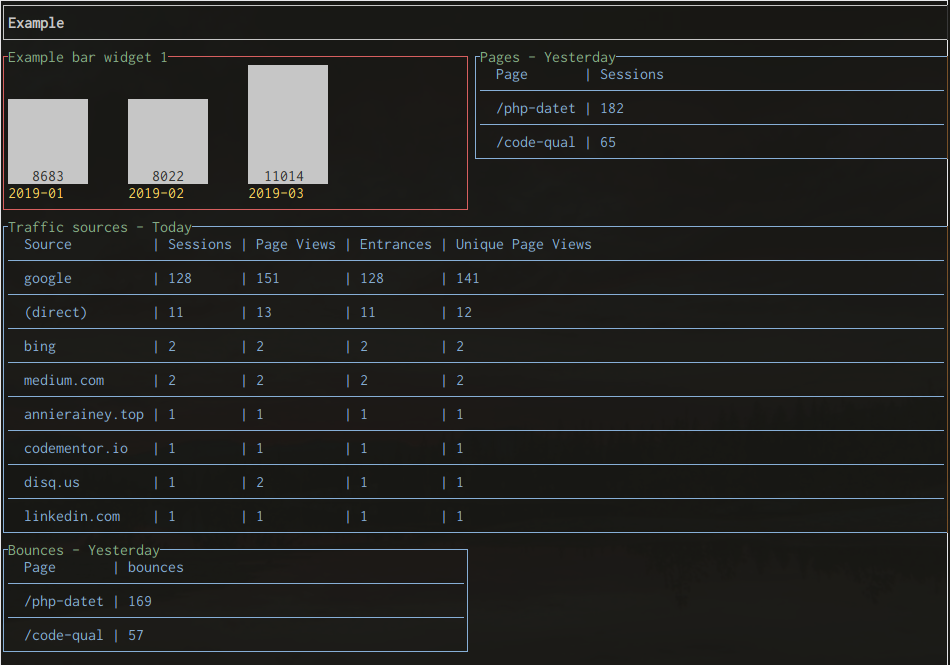
Google Analytics
For this example, we use two services: the monitoring service and the Google Analytics service.
It will show how to use two different way or providing the size (width) of any widget (using a number from 1 to 12, or a T-shirt size).
As you can see, you need to provide a keyfile and a view_id for the service google_analytics. There is a walk through how to obtain these two information here.
---
projects:
  - name: Example
    name_options:
      border_color: default
      text_color: default
      size: XXL
      bold: true
    services:
      google_analytics:
        keyfile: goanalytics-123.json
        view_id: 12345678
      monitor:
        address: "https://www.web-techno.net"
    widgets:
      - row:
          - col:
              size: "6"
              elements:
                - name: ga.bar_users
                  options:
                    title: "Example bar widget 1"
                    start_date: "15_days_ago"
                    end_date: "today"
                - name: ga.bar_users
                  options:
                    start_date: "12_months_ago"
                    end_date: "this_month"
                    title: "Example bar widget 2"
          - col:
              size: "S"
              elements:
                - name: ga.bar_new_returning
                  options:
                    title: "Example bar widget 3"
                    start_date: "3_days_ago"
                    end_date: "today"
                    metric: "users"
                    height: 20
          - col:
              size: "XS"
              elements:
                - name: ga.box_real_time
                - name: mon.box_availability
                - name: ga.box_total
                  options:
                    startDate: today
                    endDate: today
                    metric: "users"
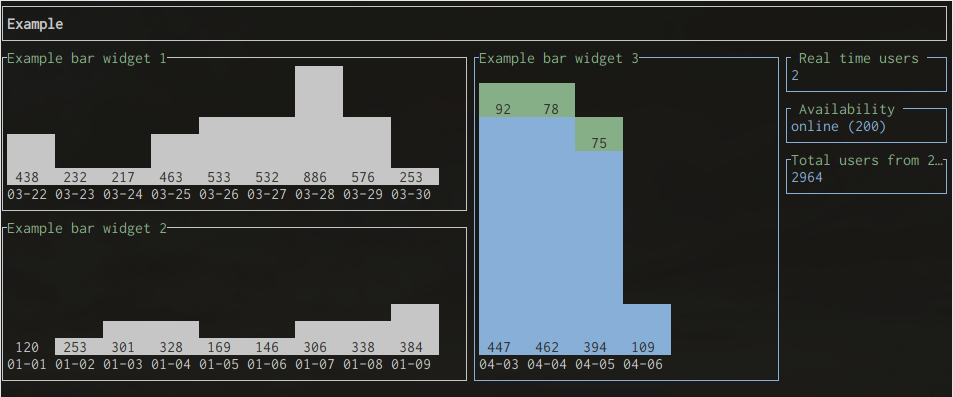
We introduce here the general configuration, where you can modify the default keyboard shortcuts to quit devdash (C-c is ctrl-c) as well as the refresh cycle of your dashboard’s data, in seconds.
You can see a complete reference of these properties here.
---
general:
  refresh: 600
  keys:
    quit: "C-c"

projects:
  - name: Example
    services:
      google_analytics:
        keyfile: goanalytics-123.json
        view_id: 12345678
    widgets:
      - row:
          - col:
              size: "6"
              elements:
                - name: ga.bar_users
                  options:
                    title: "Example bar widget 1"
                    start_date: "3_months_ago"
                    end_date: "this_month"
                    time_period: month
                    border_color: red
                    text_color: yellow
                    bar_width: 10
                    bar_gap: 5
          - col:
              size: M
              elements:
                - name: ga.table_pages
                  options:
                    title: "Pages - Yesterday"
                    start_date: "yesterday"
                    end_date: "yesterday"
                    metrics: "sessions"
                    character_limit: 10
                    row_limit: 2
      - row:
          - col:
              size: "XXL"
              elements:
                - name: ga.table_traffic_sources
                  options:
                    title: "Traffic sources - Today"
                    start_date: "today"
                    end_date: "today"
                    row_limit: 8
      - row:
          - col:
              size: M
              elements:
                - name: ga.table_pages
                  options:
                    title: "Bounces - Yesterday"
                    start_date: "yesterday"
                    end_date: "yesterday"
                    metrics: "ga:bounces"
                    character_limit: 10
                    row_limit: 2
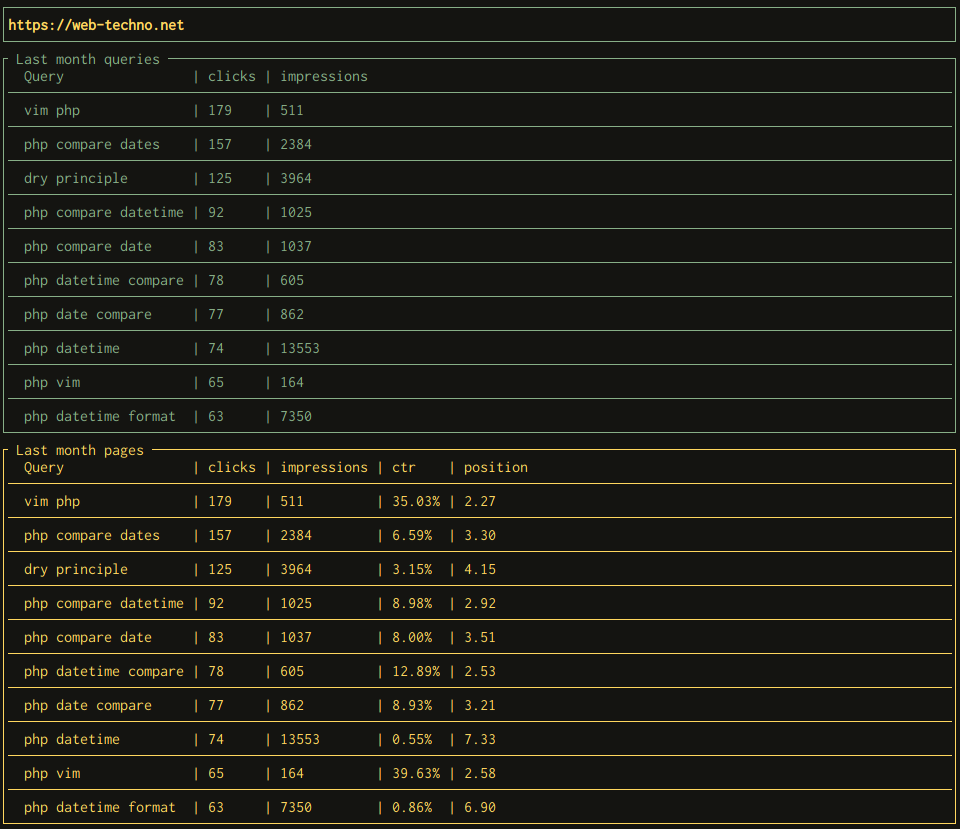
Google Search Console
The Google Search Console service in action! If you want a complete reference of its widget and configuration, it’s over here.
---
general:
  refresh: 600
  keys:
    quit: "C-c"

projects:
  - name: https://web-techno.net
    title_options:
      border_color: green
      text_color: yellow
      size: L
      bold: true
    services:
      google_search_console:
        keyfile: goanalytics-123.json
        address: 'https://web-techno.net'
    widgets:
      - row:
          - col:
              size: 12
              elements:
                - name: gsc.table_queries
                  options:
                    title: " Last month queries "
                    start_date: "last_month"
                    end_date: "last_month"
                    character_limit: 25
                    row_limit: 10
                    metrics: "clicks,impressions"
                    border_color: green
                    title_color: green
                    text_color: green
      - row:
          - col:
              size: 12
              elements:
                - name: gsc.table_pages
                  options:
                    title: " Last month pages "
                    start_date: "last_month"
                    end_date: "last_month"
                    character_limit: 25
                    row_limit: 10
                    border_color: yellow
                    title_color: yellow
                    text_color: yellow
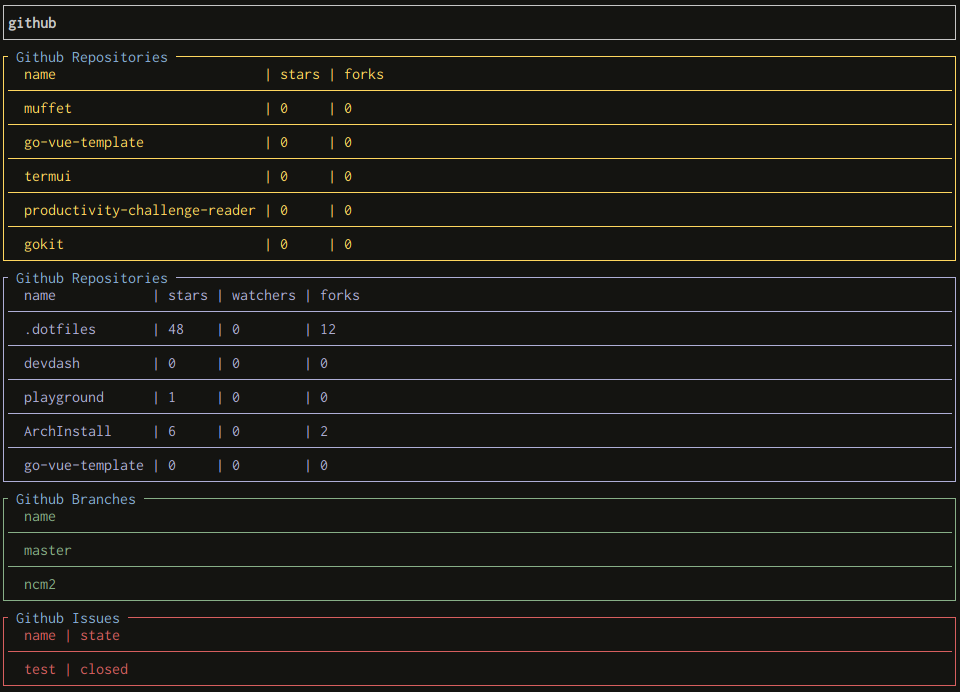
Github
Bring your Github data in DevDash! Click here to see the whole configuration reference.
---
projects:
  - name: github
    name_options:
      border_color: default
      text_color: default
      size: XXL
      bold: true
    services:
      github:
        token: 123456789abcde12345av
        owner: Phantas0s
        repository: .dotfiles
    widgets:
      - row:
          - col:
              size: 12
              elements:
                - name: github.table_repositories
                  options:
                    metrics: stars,forks
                    row_limit: 5
                    title_color: blue
                    text_color: yellow
                    border_color: yellow
                    order: created
                - name: github.table_repositories
                  options:
                    row_limit: 5
                    title_color: blue
                    text_color: magenta
                    border_color: magenta
                - name: github.table_branches
                  options:
                    row_limit: 3
                    title_color: blue
                    text_color: green
                    border_color: green
                - name: github.table_issues
                  options:
                    row_limit: 10
                    title_color: blue
                    text_color: red
                    border_color: red