navigation
![]()
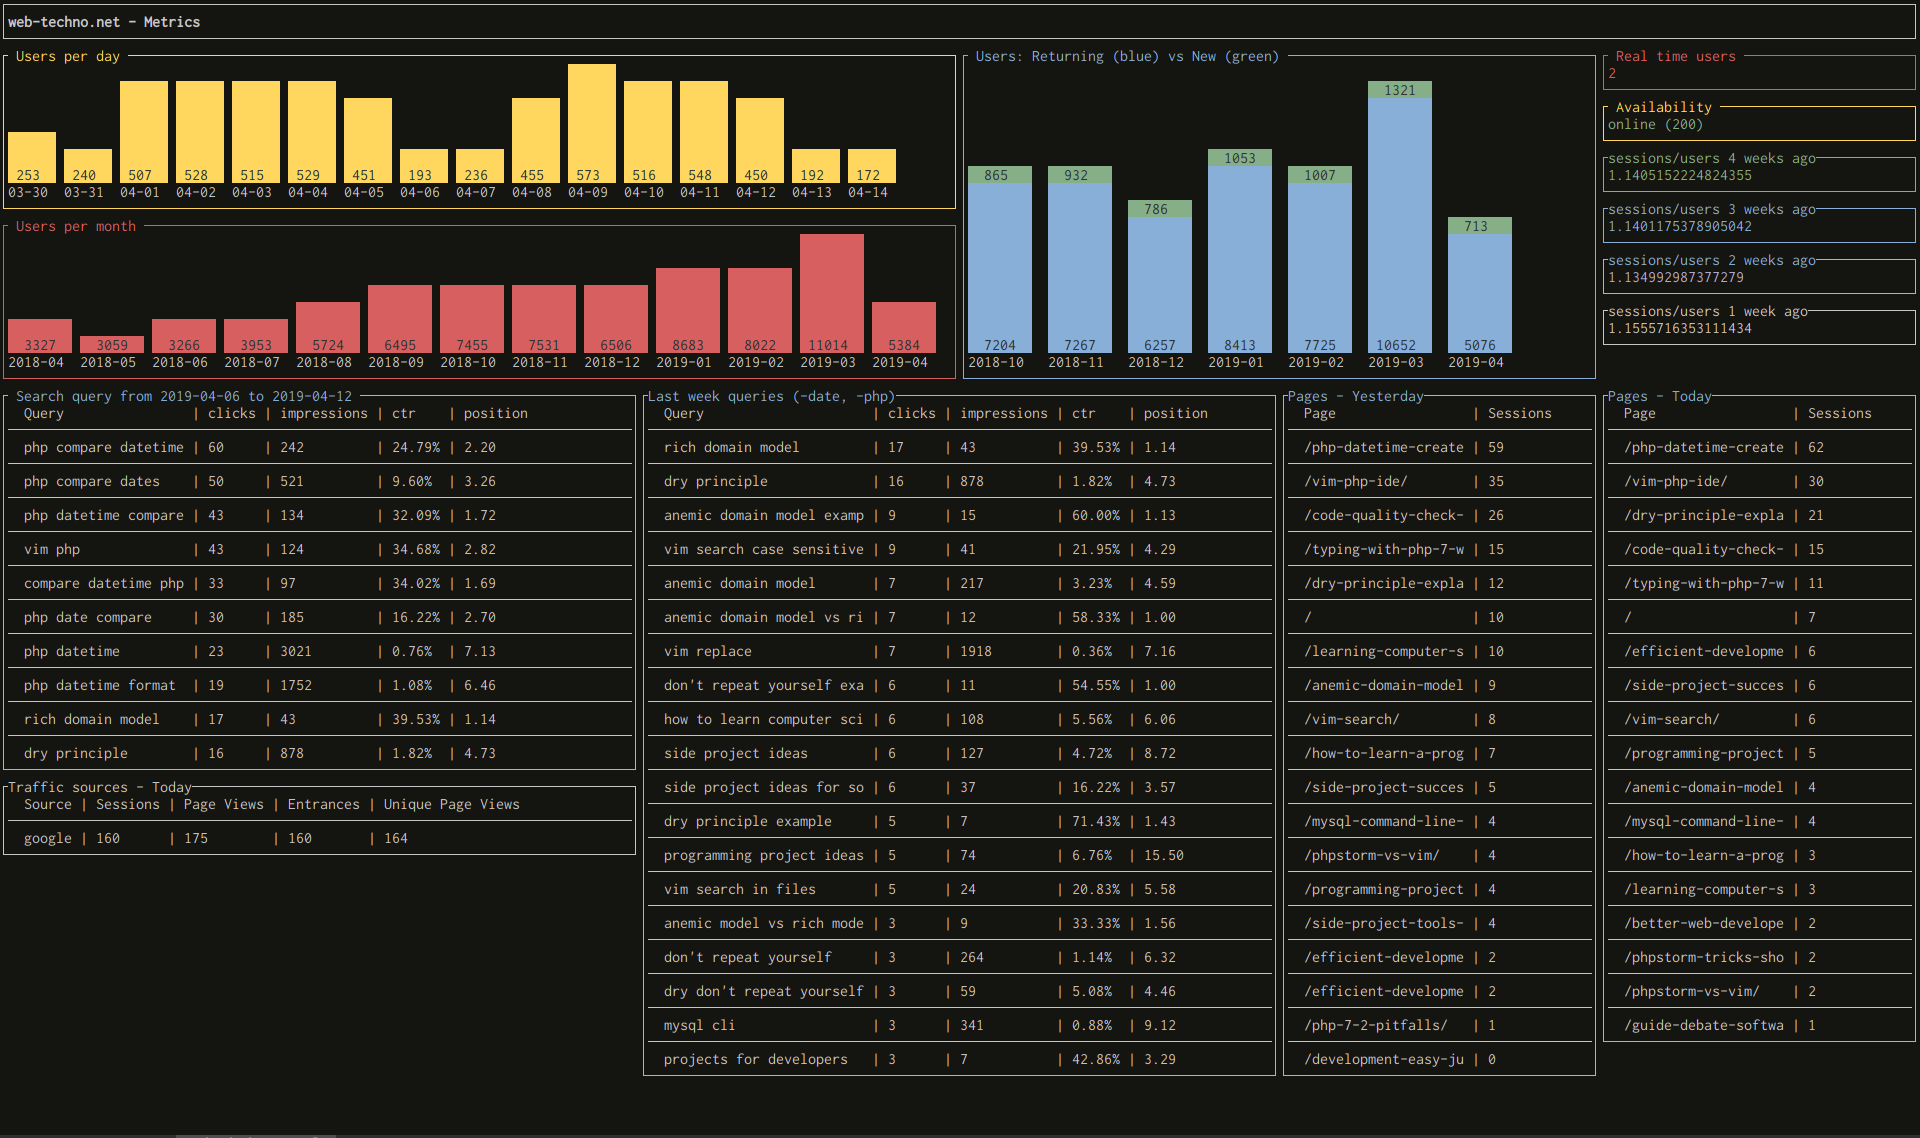
DevDash is a highly configurable terminal dashboard for developers and creators.
It will allow you to choose and display the most up-to-date metrics you need, at one place, from:
- Google Analytics
- Google Search Console
- Github
- Travis-ci
- Feedly
- Output of shell commands from your local computer or a remote system (via SSH)
The data will be automatically refreshed while you’re doing other productive tasks.
- To get started and creating your first dashboard, or see DevDash in action with many examples (including their configuration), it’s over there.
- If you search the complete reference for DevDash dashboard’s configuration, you need to click on this link.
- In order to change the display of your widgets (colors or size), you can directly go here.
- Finally, to understand how to use time period for many widgets in DevDash, you can go there.